Taken from an article posted on NJ 101.5 – Average NJ property tax bill near $9,300 – Check your town here
Property taxes in New Jersey climbed by nearly 2% again last year, restrained by the cap but still amounting to a $583 million tax hike. The statewide tab now exceeds $31 billion.
The tax bill on the average home unofficially rose to $9,266, according to a New Jersey 101.5 review of county abstracts of ratables and Department of Treasury home assessment data. That’s a $154 increase from a year earlier.
The Governor’s Office told NJ.com on Friday that it was slightly higher, at $9,284. Official numbers from the state Department of Community Affairs were expected to be released 10 days ago but still have not been posted, though should be soon.
Gov. Phil Murphy, who will be inaugurated for a second term Tuesday, talked up his property tax record last week in his fourth State of the State address.
“We’re making more progress against property taxes than any administration before us,” Murphy said. “Through the policies we’ve put in place, and the community investments we’ve made, our administration has slowed the rate of property tax growth more than any of the previous four administrations – a record that includes four of the lowest year-over-year increases in property taxes on record.”
Sen. Declan O’Scanlon, R-Monmouth, said property tax increases have slowed mainly because of the 2% cap installed a decade ago. He said they’re still under pressure due to the lapsing of an arbitration cap on police salaries and would benefit from pension reforms that aren’t on the agenda.
“This administration has benefited from the reforms that have been in place since before they got into office,” O’Scanlon said.
“This year didn’t happen to be a particularly bad year, and that’s good,” he said. “But no one should fool themselves into believing that we’ve solved their property tax problem. There’s still a lot of work to do.”
The total tax levy statewide for county, municipal and school budgets was up 1.9% to $31.4 billion. Add in the $324 million for 267 special taxing districts not included in the standard analysis, including 175 fire districts, and the bill is around $31.75 billion.
For the average home in the state, which is now assessed at about $335,000, the bill jumped 1.7% last year. The $154 increase exactly equaled the average increase over the prior decade and was about half the $315 yearly increase recorded in the decade before that.
Over the last 10 years, property tax bills have risen by an average of 1.8% a year. That compares with nearly 5.3% in the decade before that. But that amounted to a $1,507 increase over the last decade, up from $7,759 in 2011.
Schools, which account for about 53% of the statewide property tax bill, accounted for 64.5% of the increase in 2021. School taxes rose 2.3%, compared with 1.6% for county taxes and 1.3% for municipal taxes.
Murphy said his administration spent $3 billion more on public schools in his first term than the state had in the prior four years, including $1.5 billion this school year alone.
“We are doing this not just because our kids deserve it but because our property taxpayers do, too,” Murphy said. “School funding is property tax relief. Every single one of these dollars we as a state have invested is a dollar kept in the pockets of property taxpayers.”
Assembly Minority Leader John DiMaio, R-Warren, said state revenue growth should be redirected to schools and municipal aid and tied to cutting property taxes.
“We must lower the cost people pay in every facet of life, beginning with their taxes,” DiMaio said. “This is what people want.”
Two hundred of the state’s 565 municipalities had average residential tax bills of $10,000 or more in 2021, up by 11 from one year earlier.
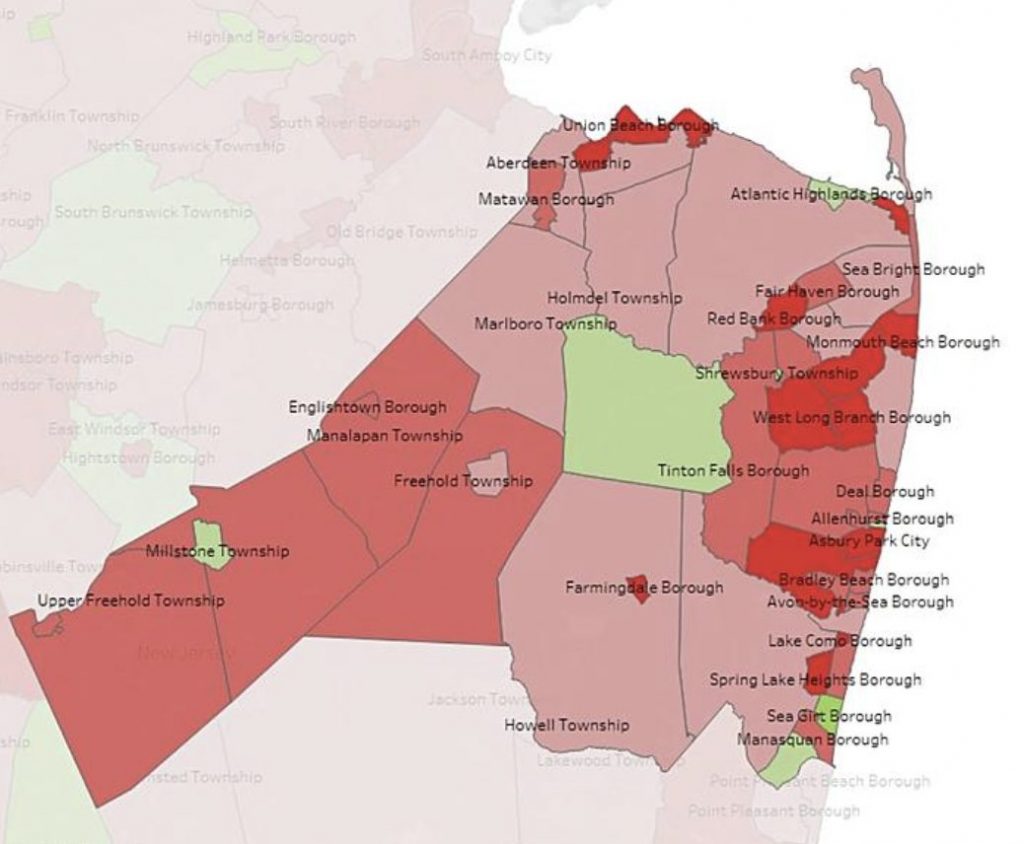
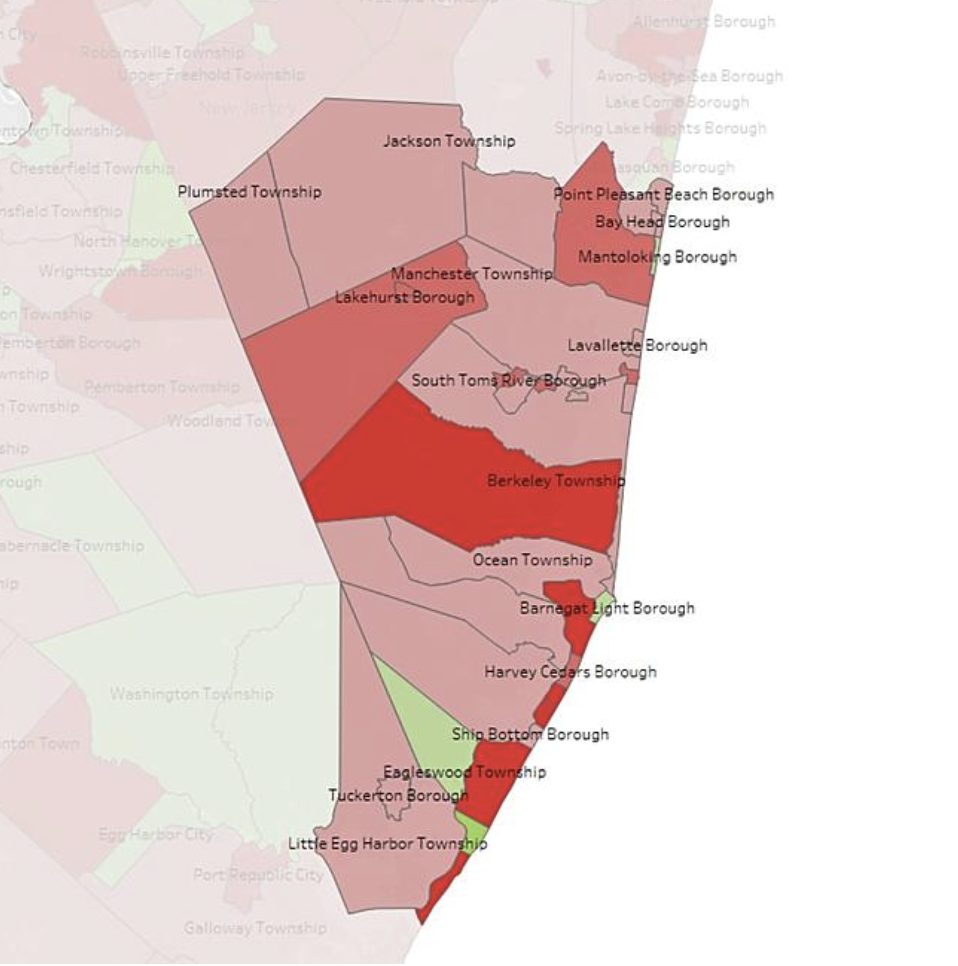
I’m highlighting property taxes in the main two counties I work in, Monmouth and Ocean Counties below.

Monmouth County
• Aberdeen Twp Avg. tax bill ’21: $8,007 | 1-year change: 1.0%
• Allenhurst Boro Avg. tax bill ’21: $16,920 | 1-year change: 3.4%
• Allentown Boro Avg. tax bill ’21: $8,860 | 1-year change: 3.0%
• Asbury Park City Avg. tax bill ’21: $6,428 | 1-year change: 8.8%
• Atlantic Highlands Boro Avg. tax bill ’21: $9,682 | 1-year change: -0.3%
• Avon By The Sea Boro Avg. tax bill ’21: $10,627 | 1-year change: 2.4%
• Belmar Boro Avg. tax bill ’21: $7,803 | 1-year change: 1.8%
• Bradley Beach Boro Avg. tax bill ’21: $8,302 | 1-year change: 2.4%
• Brielle Boro Avg. tax bill ’21: $11,791 | 1-year change: -0.2%
• Colts Neck Twp Avg. tax bill ’21: $14,745 | 1-year change: -0.9%
• Deal Boro Avg. tax bill ’21: $19,774 | 1-year change: 3.4%
• Eatontown Boro Avg. tax bill ’21: $8,569 | 1-year change: 4.5%
• Englishtown Boro Avg. tax bill ’21: $7,510 | 1-year change: 2.5%
• Fair Haven Boro Avg. tax bill ’21: $16,393 | 1-year change: 3.2%
• Farmingdale Boro Avg. tax bill ’21: $7,628 | 1-year change: 4.3
• Freehold Boro Avg. tax bill ’21: $7,233 | 1-year change: 1.9%
• Freehold Twp Avg. tax bill ’21: $9,415 | 1-year change: 3.7%
• Hazlet Twp Avg. tax bill ’21: $8,701 | 1-year change: 1.9%
• Highlands Boro Avg. tax bill ’21: $7,276 | 1-year change: 4.3%
• Holmdel Twp Avg. tax bill ’21: $14,046 | 1-year change: 0.4%
• Howell Twp Avg. tax bill ’21: $8,220 | 1-year change: 0.3%
• Interlaken Boro Avg. tax bill ’21: $9,078 | 1-year change: 2.7%
• Keansburg Boro Avg. tax bill ’21: $5,728 | 1-year change: 5.2%
• Keyport Boro Avg. tax bill ’21: $7,500 | 1-year change: 4.4%
• Lake Como Avg. tax bill ’21: $7,123 | 1-year change: 13.1%
• Little Silver Boro Avg. tax bill ’21: $13,934 | 1-year change: 0.7%
• Loch Arbour Village Avg. tax bill ’21: $11,424 | 1-year change: -0.1%
• Long Branch City Avg. tax bill ’21: $10,046 | 1-year change: 1.7%
• Manalapan Twp Avg. tax bill ’21: $9,361 | 1-year change: 2.8%
• Manasquan Boro Avg. tax bill ’21: $10,243 | 1-year change: 2.3%
• Marlboro Twp Avg. tax bill ’21: $11,320 | 1-year change: 1.1%
• Matawan Boro Avg. tax bill ’21: $9,980 | 1-year change: 2.4%
• Middletown Twp Avg. tax bill ’21: $9,621 | 1-year change: 0.5%
• Millstone Twp Avg. tax bill ’21: $12,412 | 1-year change: 3.2%
• Monmouth Beach Boro Avg. tax bill ’21: $10,001 | 1-year change: 6.0%
• Neptune City Boro Avg. tax bill ’21: $6,985 | 1-year change: 2.8%
• Neptune Twp Avg. tax bill ’21: $7,366 | 1-year change: 5.3%
• Ocean Twp Avg. tax bill ’21: $10,502 | 1-year change: 2.2%
• Oceanport Boro Avg. tax bill ’21: $11,232 | 1-year change: 7.8%
• Red Bank Boro Avg. tax bill ’21: $9,084 | 1-year change: 4.2%
• Roosevelt Boro Avg. tax bill ’21: $8,040 | 1-year change: -1.3%
• Rumson Boro Avg. tax bill ’21: $21,541 | 1-year change: 1.8%
• Sea Bright Boro Avg. tax bill ’21: $8,382 | 1-year change: 3.4%
• Sea Girt Boro Avg. tax bill ’21: $13,084 | 1-year change: -2.9%
• Shrewsbury Boro Avg. tax bill ’21: $12,318 | 1-year change: 2.0%
• Shrewsbury Twp Avg. tax bill ’21: $4,188 | 1-year change: -1.5%
• Spring Lake Boro Avg. tax bill ’21: $13,286 | 1-year change: 2.0%
• Spring Lake Heights Boro Avg. tax bill ’21: $7,448 | 1-year change: 4.2%
• Tinton Falls Boro Avg. tax bill ’21: $7,251 | 1-year change: 2.0%
• Union Beach Boro Avg. tax bill ’21: $7,349 | 1-year change: 5.8%
• Upper Freehold Twp Avg. tax bill ’21: $12,189 | 1-year change: 2.4%
• Wall Twp Avg. tax bill ’21: $9,387 | 1-year change: 1.4%
• West Long Branch Boro Avg. tax bill ’21: $10,599 | 1-year change: 4.2%

• Barnegat Light Boro Avg. tax bill ’21: $7,121 | 1-year change: -0.6%
• Barnegat Twp Avg. tax bill ’21: $6,806 | 1-year change: 1.1%
• Bay Head Boro Avg. tax bill ’21: $13,919 | 1-year change: 0.7%
• Beach Haven Boro Avg. tax bill ’21: $9,058 | 1-year change: -3.0%
• Beachwood Boro Avg. tax bill ’21: $5,272 | 1-year change: 1.9%
• Berkeley Twp Avg. tax bill ’21: $4,558 | 1-year change: 0.8%
• Brick Twp Avg. tax bill ’21: $6,959 | 1-year change: 2.1%
• Eagleswood Twp Avg. tax bill ’21: $6,654 | 1-year change: -2.0%
• Harvey Cedars Boro Avg. tax bill ’21: $9,923 | 1-year change: 2.1%
• Island Heights Boro Avg. tax bill ’21: $8,259 | 1-year change: 0.8%
• Jackson Twp Avg. tax bill ’21: $7,896 | 1-year change: 1.5%
• Lacey Twp Avg. tax bill ’21: $6,258 | 1-year change: 4.0%
• Lakehurst Boro Avg. tax bill ’21: $5,183 | 1-year change: 2.2%
• Lakewood Twp Avg. tax bill ’21: $7,495 | 1-year change: 0.8%
• Lavalette Boro Avg. tax bill ’21: $7,269 | 1-year change: 1.1%
• Little Egg Harbor Twp Avg. tax bill ’21: $5,285 | 1-year change: 1.5%
• Long Beach Twp Avg. tax bill ’21: $9,982 | 1-year change: 5.1%
• Manchester Twp Avg. tax bill ’21: $4,318 | 1-year change: 3.2%
• Mantoloking Boro Avg. tax bill ’21: $19,287 | 1-year change: -0.1%
• Ocean Gate Boro Avg. tax bill ’21: $5,482 | 1-year change: 0.2%
• Ocean Twp Avg. tax bill ’21: $5,783 | 1-year change: 1.4%
• Pine Beach Boro Avg. tax bill ’21: $6,926 | 1-year change: 2.6%
• Plumsted Twp Avg. tax bill ’21: $6,755 | 1-year change: 0.8%
• Pt. Pleasant Beach Boro Avg. tax bill ’21: $8,980 | 1-year change: 1.2%
• Pt. Pleasant Boro Avg. tax bill ’21: $8,259 | 1-year change: 1.6%
• Seaside Heights Boro Avg. tax bill ’21: $5,733 | 1-year change: 3.0%
• Seaside Park Boro Avg. tax bill ’21: $8,560 | 1-year change: 1.3%
• Ship Bottom Boro Avg. tax bill ’21: $6,938 | 1-year change: 1.4%
• South Toms River Boro Avg. tax bill ’21: $5,123 | 1-year change: 3.3%
• Stafford Twp Avg. tax bill ’21: $6,633 | 1-year change: 0.7%
• Surf City Boro Avg. tax bill ’21: $7,850 | 1-year change: 4.6%
• Toms River Twp Avg. tax bill ’21: $6,744 | 1-year change: 1.1%
• Tuckerton Boro Avg. tax bill ’21: $5,665 | 1-year change: 0.4%
Not in Monmouth or Ocean counties? Click on this link for an interactive map of the whole state.


