As we kick off the new year, many families have made resolutions to enter the housing market in 2019. Whether you are thinking of finally ditching your landlord and buying your first home or selling your starter house to move into your forever home, there are two pieces of the real estate puzzle you need to watch carefully: interest rates & inventory.
Interest Rates
Mortgage interest rates had been on the rise for much of 2018, but they made a welcome reversal at the end of the year. According to Freddie Mac’s latest Primary Mortgage Market Survey, rates climbed to 4.94% in November before falling to 4.62% for a 30-year fixed rate mortgage last week. Despite the recent drop, interest rates are projected to reach 5% in 2019.
The interest rate you secure when buying a home not only greatly impacts your monthly housing costs, but also impacts your purchasing power.
Purchasing power, simply put, is the amount of home you can afford to buy for the budget you have available to spend. As rates increase, the price of the house you can afford to buy will decrease if you plan to stay within a certain monthly housing budget.
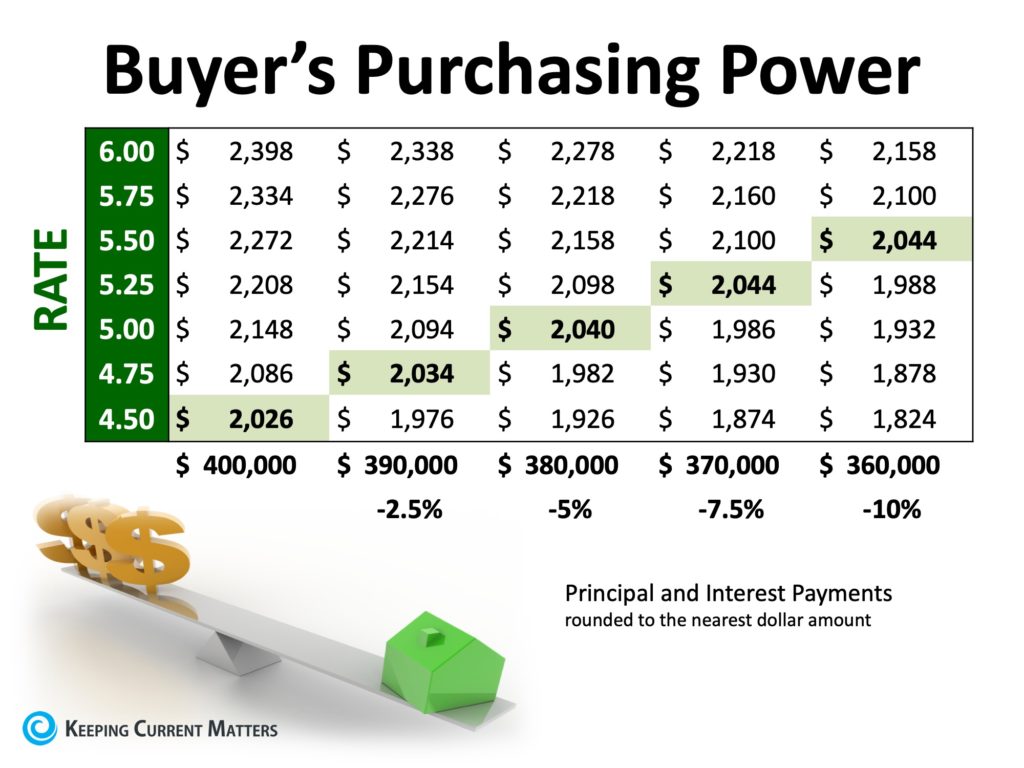
The chart below shows the impact that rising interest rates would have if you planned to purchase a $400,000 home while keeping your principal and interest payments between $2,020-$2,050 a month.

With each quarter of a percent increase in interest rate, the value of the home you can afford decreases by 2.5% (in this example, $10,000).
Inventory
A ‘normal’ real estate market requires there to be a 6-month supply of homes for sale in order for prices to increase only with inflation. According to the National Association of Realtors (NAR), listing inventory is currently at a 3.9-month supply (still well below the 6-months needed), which has put upward pressure on home prices. Home prices have increased year-over-year for the last 81 straight months.
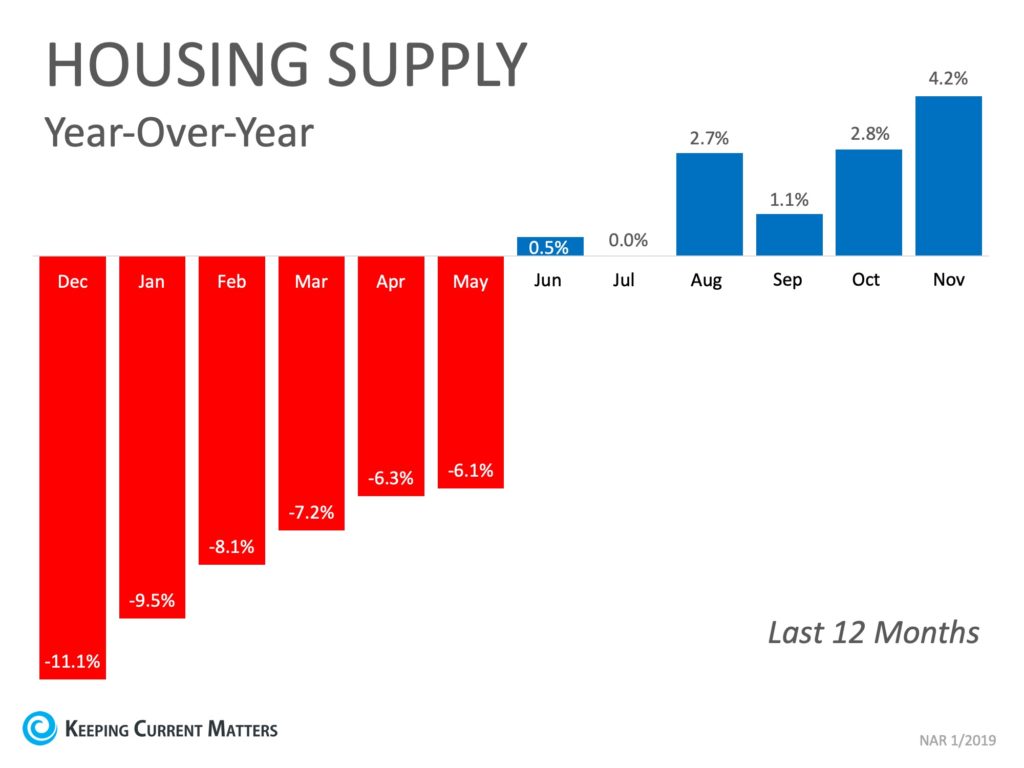
The inventory of homes for sale in the real estate market had been on a steady decline and experienced year-over-year drops for 36 straight months (from July 2015 to May 2018), but we are starting to see a shift in inventory over the last six months.
The chart below shows the change in housing supply over the last 12 months compared to the previous 12 months. As you can see, since June, inventory levels have started to increase as compared to the same time last year.

This is a trend to watch as we move further into the new year. If we continue to see an increase in homes for sale, we could start moving further away from a seller’s market and closer to a normal market.
(Source: Keeping Current Matters)


