BY: Scholastica (Gay) Cororaton of the National Association of Realtors
Every month, the National Association of REALTORS® conducts the REALTORS® Confidence Index Survey to gather on-the-ground information from REALTORS®.1 This feedback from REALTORS® provides valuable information at the local level that are then aggregated to create a national or broad picture of housing market trends. Here are five key trends from the RCI survey of how the pandemic impacted the housing market in 2020.
1. Buyers competed more intensely for fewer homes
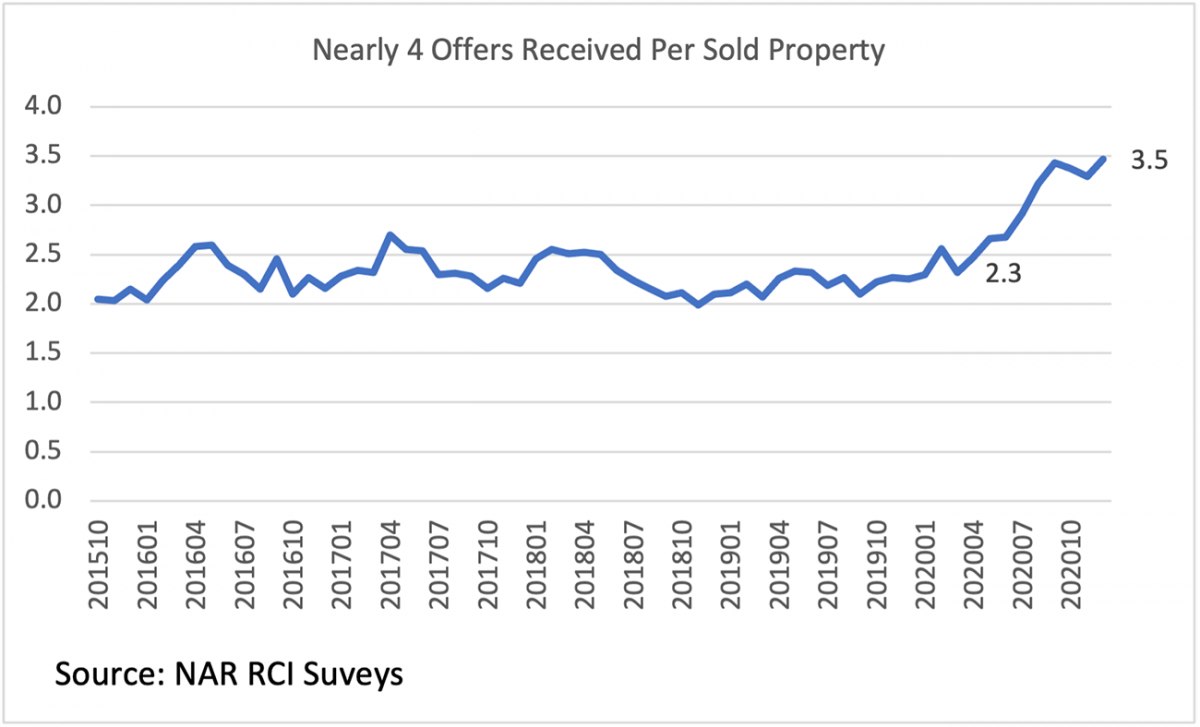
With the Fed’s quick and massive policy to prevent a recession, mortgage rates fell to below 3%2 starting in July, spurring an increase in demand from both first-time and repeat buyers that saw existing home sales rise to 5.6 million, their highest level since 2006. However, the supply of homes on the market has tremendously lagged behind demand, intensifying buyer competition and quickening the pace at which homes sold. REALTORS® reported that there were nearly four offers per sold property from about 2 in 2019. Properties typically sold at an average of 26 days compared to 34 days in 2019. With more intense demand, the median sales price rose 13% to $309,100 as of December 2020.
2. More first-time buyers
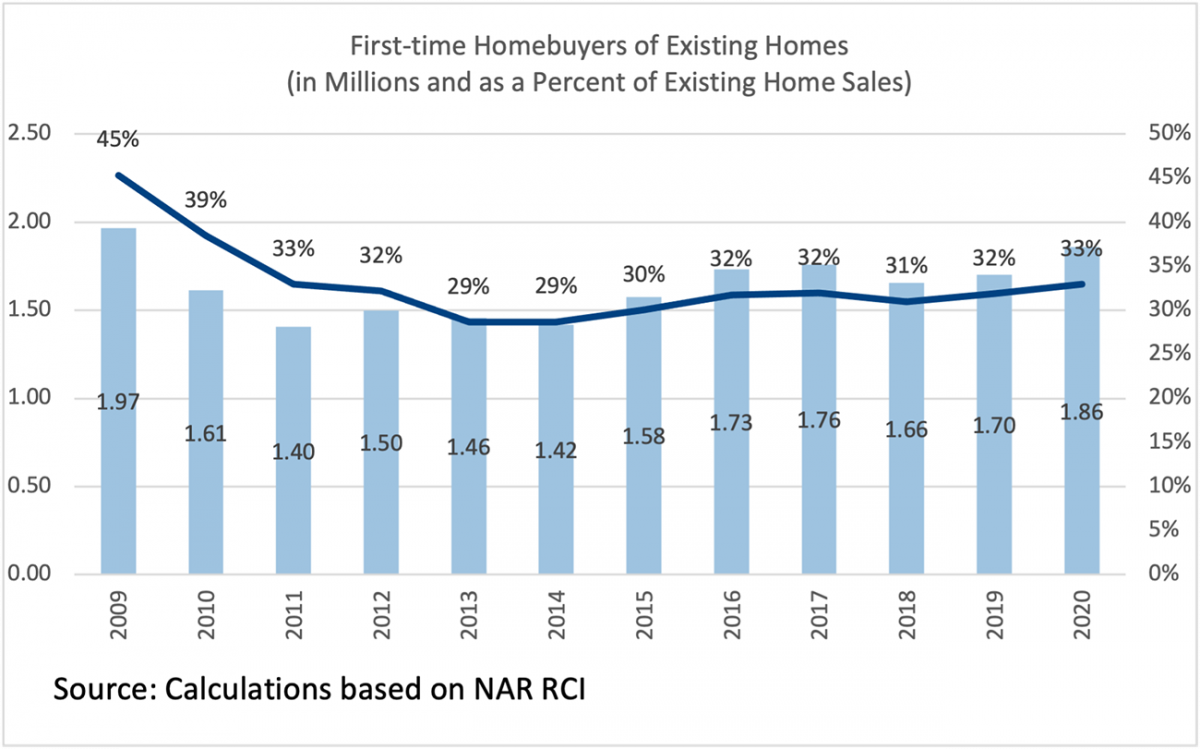
With low mortgage rates, the first-time buyer share rose to 33% from 32% in 2019. In level terms, there were 1.86 million first time buyers, a 9% increase from 1.7 million in 2019 (compared to 5.6% overall increase in existing home sales).
First-time buyers could have made a bigger entry with mortgage rates falling by nearly a percentage point in 2020, but rising prices made a home purchase less affordable.3 The lack of supply for lower-priced homes on the market and the higher down payment and closing costs that go with rising home prices likely kept potential buyers on the sidelines.
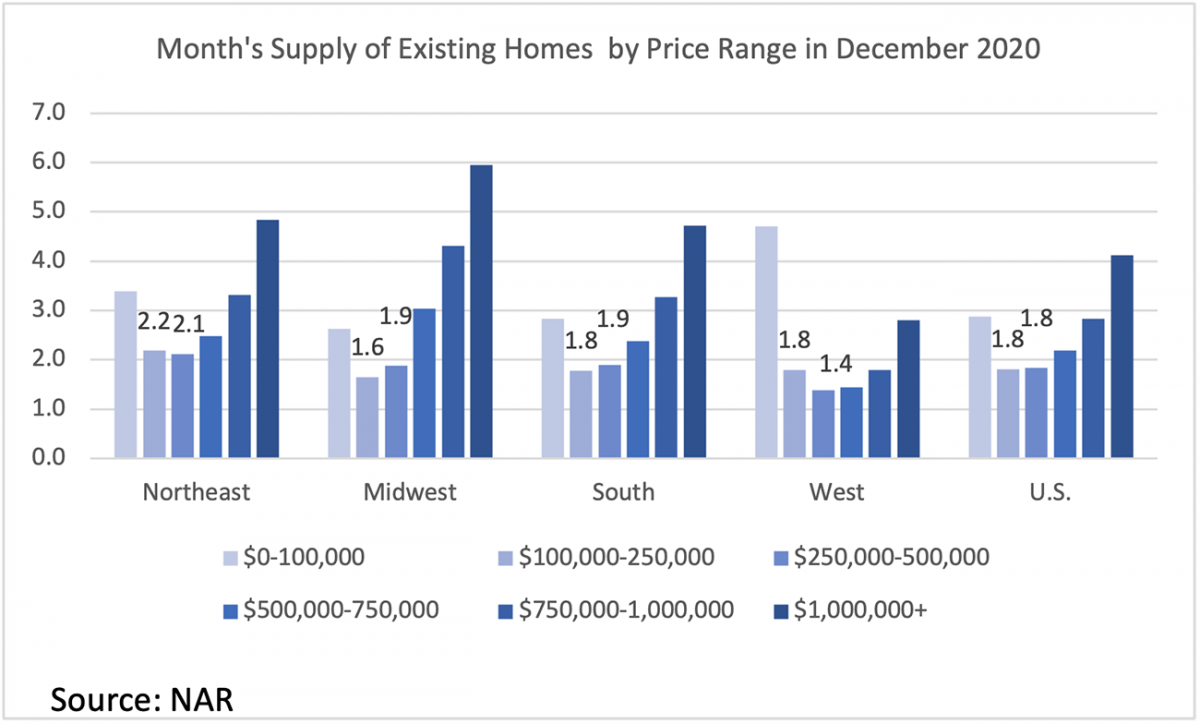
According to NAR’s Profile of Home Buyers and Sellers, the starter price of first-time buyers is about 85% of the market price, or around $250,000 (85% of the median sales price of $296,500 in 2020 ). However, supply is tight at that price range, equivalent to 1.8 months of monthly housing demand, well below the 5 or 6 months that keep prices from rising faster than income growth. The average weekly wage was about 6% higher in December 2020 from one year ago, a pace that is just about half the home price appreciation in December 2020.
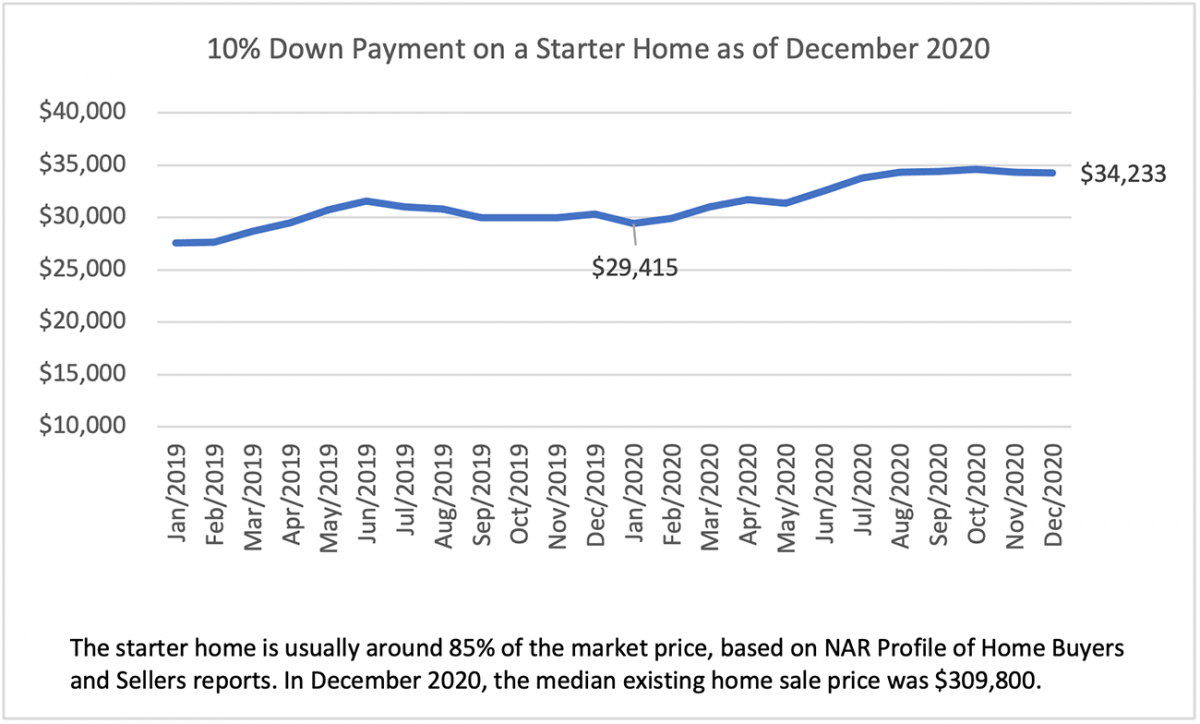
Rising prices also mean a higher down payment. As of December 2020, a 10% down payment and a 3% closing cost on a starter home amounted to $34,2334, an increase of $4,800 compared to the amount based on prices one year ago. While some buyers may have used their unspent leisure or travel budget for down payment and bought a home, some interested buyers may also have decided to postpone a home purchase due to job loss, to have a liquid financial asset (cash) on hand to meet an unexpected turn of events (sickness, job loss), or because of concerns that house prices may fall during the economic downturn.
3. More vacation home buyers and sales in suburbs, rural, small towns, resort areas
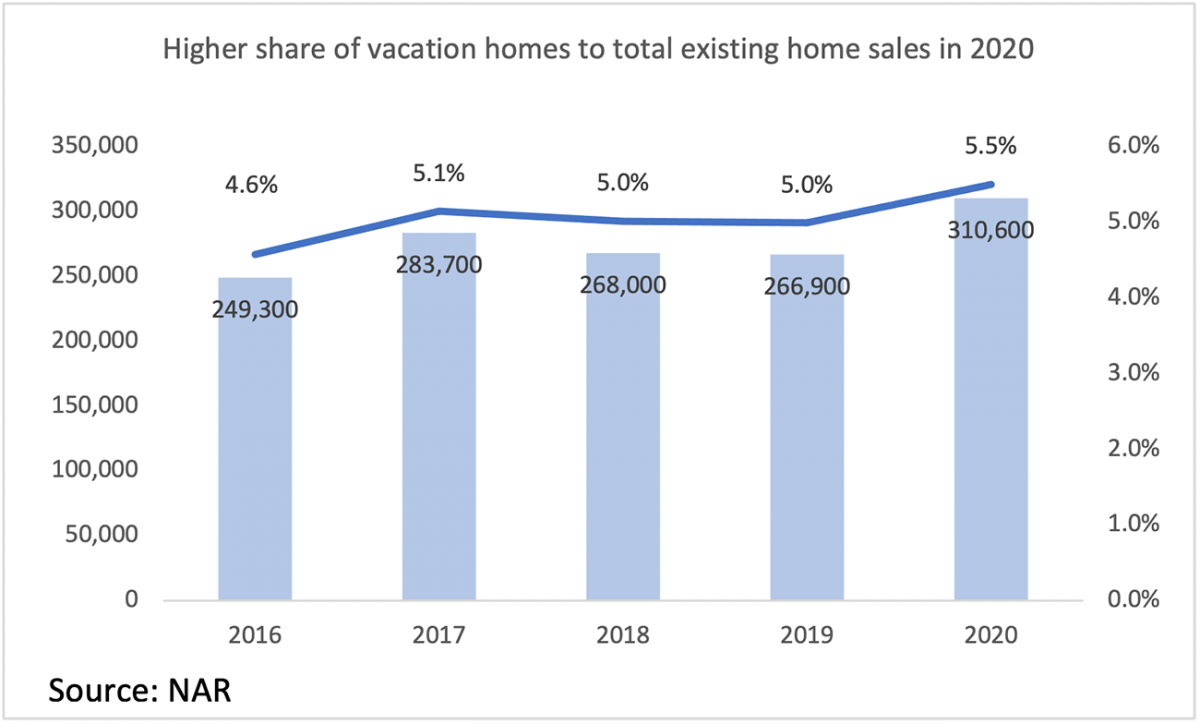
With people able to work from home (anywhere) and with people seeking less congested places, REALTORS® reported more vacation home sales. Home sales of vacation homes rose to 310,600, up 16.3% from the level in 2019, outpacing the 5.6% growth in total existing home sales in 2020 and the 9% growth in first-time buyer sales. The share of vacation homes rose to 5.5% in 2020 from about 5% in prior years.
Based on a sample of 180 vacation home counties (a county where vacation homes account for at least 20% of the housing stock), 81% of these counties had higher sales in 2020 compared to 2019. Counties that are popular vacation destinations had double-digit growth in sales, such as Lee, Florida (10%); Barnstable, Mass. (20%); Horry, South Carolina (15%); Sussex, Delaware (19%); Brunswick, North Carolina (31%); Cape May, New Jersey (19%); Worcester, Maryland (26%); Camden, Missouri (35%); Crow Wing, Minnesota (16%), Summit Utah (44%), among others.
Related to more buyers purchasing vacation homes, nearly 40% of REALTORS® reported they have a higher share of clients who live in a city who want to purchase a property in a suburb or rural area compared to the share in January 2020 (pre-pandemic).
The fraction of REALTOR® respondents who reported an increase in city clients seeking to purchase outside the city is higher in Northeast states like Vermont (70% of respondents), New Hampshire (60%), Connecticut (58%), New Jersey (58%), and Maine (57%).
In the West region, half of respondents reported more city dwellers purchasing outside the city in Montana and Wyoming.
Around the Washington, DC area, 46% of REALTOR® respondents from West Virginia reported a higher share of city clients purchasing in suburbs and small towns.
To be clear, these percentages reflect the areas where the respondents are coming from. For example, if the respondents from the state (e.g., Florida) are mainly from a large city/metro area (e.g. Miami), the share will tend to be low.
4. Buyers looked for bigger homes and home features to support working from home
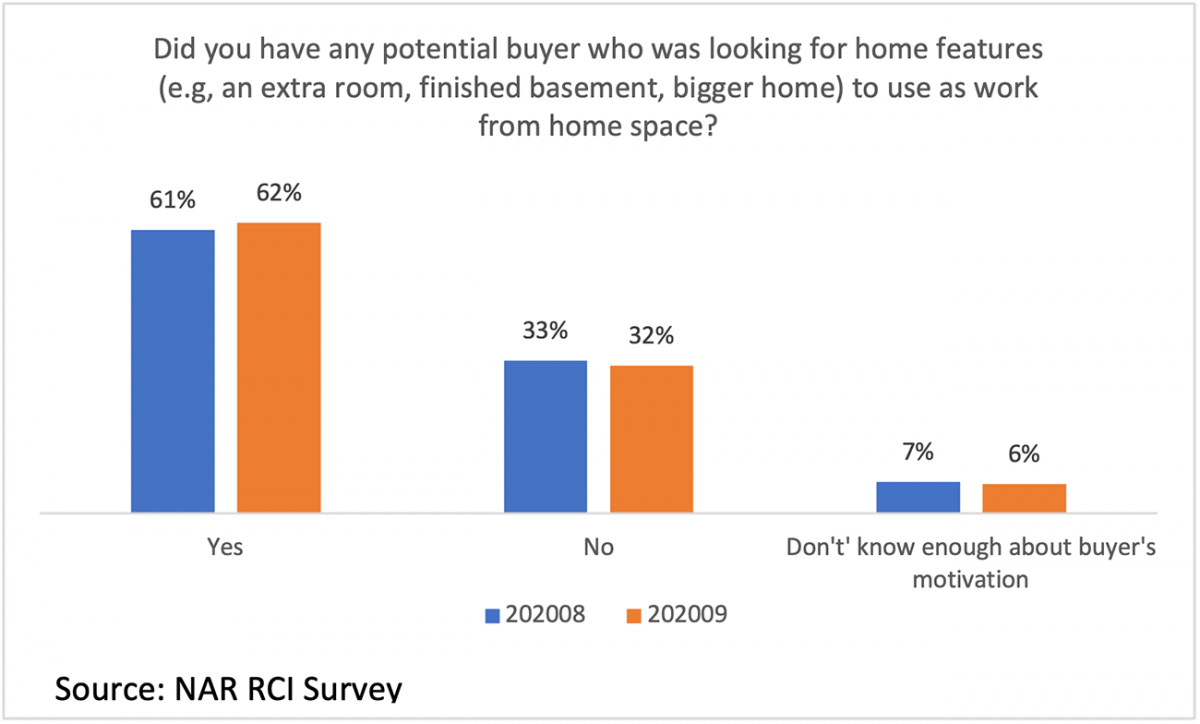
With 24% of the workforce still working from home5, most buyers looked for a bigger home or home features that could function as a space to use for working from home such as a basement or a den, according to 62% of REALTOR® respondents.
The preference for single-family homes can also be gleaned from the increase in sales of detached single-family homes and townhomes versus the decline in condominium sales. In 2020, single-family home sales rose 6.3% while condominium sales decreased by 0.3%.
5. Rise, then decline, in the fraction of buyers purchasing a property based on virtual showing only
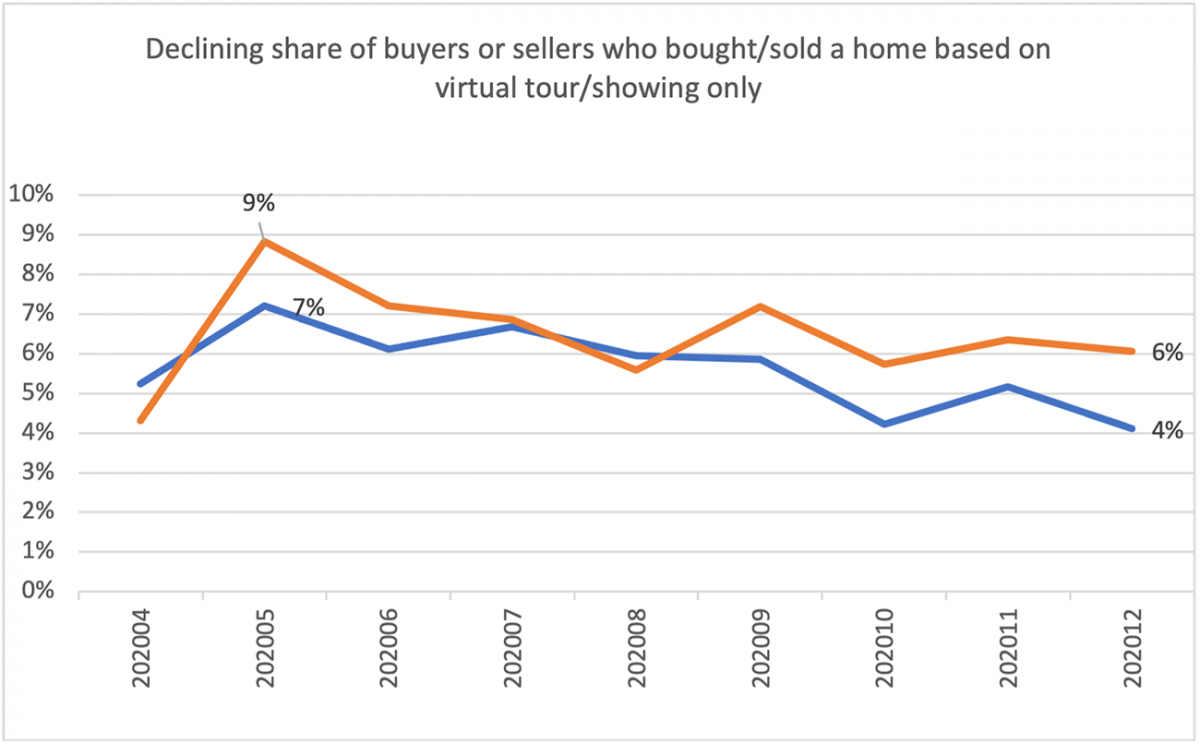
At the height of the pandemic in March and April, 9% of buyers purchased a property based on a virtual showing alone.6 With states ending the stay-in-place measures, that share has declined to 6%. Housing is the biggest investment most persons will make in their lifetime, so understandably, and properly so, most buyers prefer to see the home physically before making a purchase. Some buyers could be buying a home without seeing the home, but they may still have a trusted agent, relative, or friend who viewed the home.
In May, 7% of sellers also just sold the home based on a virtual showing, but the share has also gone down to 4% as more buyer prefer to view the home physically before making a purchase.
What’s 2021 Looking Like?
The year 2021 can only be better for the housing market than 2020, with the economy continuing to improve in 2021 under continued low mortgage rates, higher fiscal spending, and aggressive COVID-19 immunization. NAR projects existing-home sales to increase to 6 million in 2021 (from 5.6 million in 2020). Low mortgage rates hovering at 3% will continue to attract first-time and repeat buyers. Housing starts have started to increase, to an annualized rate of 1.7 million as of December, and if this pace continues, the higher supply will help keep prices from appreciation at double-digit rates by the second half of the year. Buyers may also wait for the $15,000 First Down Payment Tax Credit to make a home purchase, so that could push sales in 2022.


