This month, Arch Mortgage Insurance released their spring Housing and Mortgage Market Review. The report explained that an increase in mortgage rates and/or home prices would impact monthly payments this way:
A 5% increase in home prices increases payments by roughly 5%
A 1% rise in interest rates increases payments by roughly 13% or 14%
That begs the question…
What if both rates and prices increase as predicted?
The report revealed:
“If interest rates and home prices rise by year-end in the ballpark of what most analysts are forecasting, monthly mortgage payments on a new home purchase could increase another 10–15%. That would make 2018 one of the worst full-year deteriorations in affordability for the past 25 years.”
The percent increase in mortgage payments would negatively impact affordability. But, how would affordability then compare to historic norms?
Per the report:
“For the U.S. overall, even if affordability were to deteriorate as forecasted, affordability would still be reasonable by historic norms. That is because the percentage of pre-tax income needed to buy a typical home in 2019 would still be similar to the historical average during 1987–2004. Thus, nationally at least, even with higher rates and home prices, affordability will just revert to historical norms.”
What about home prices?
A decrease in affordability will cause some concern about home values. Won’t an increase in mortgage payments negatively impact the housing market? The report addressed this question:
“Even recent interest rate increases and higher taxes on some upper-income earners didn’t slow the market, as many had feared…Short of a war or stock market crash, housing markets could continue to surprise on the upside over the next few years.”
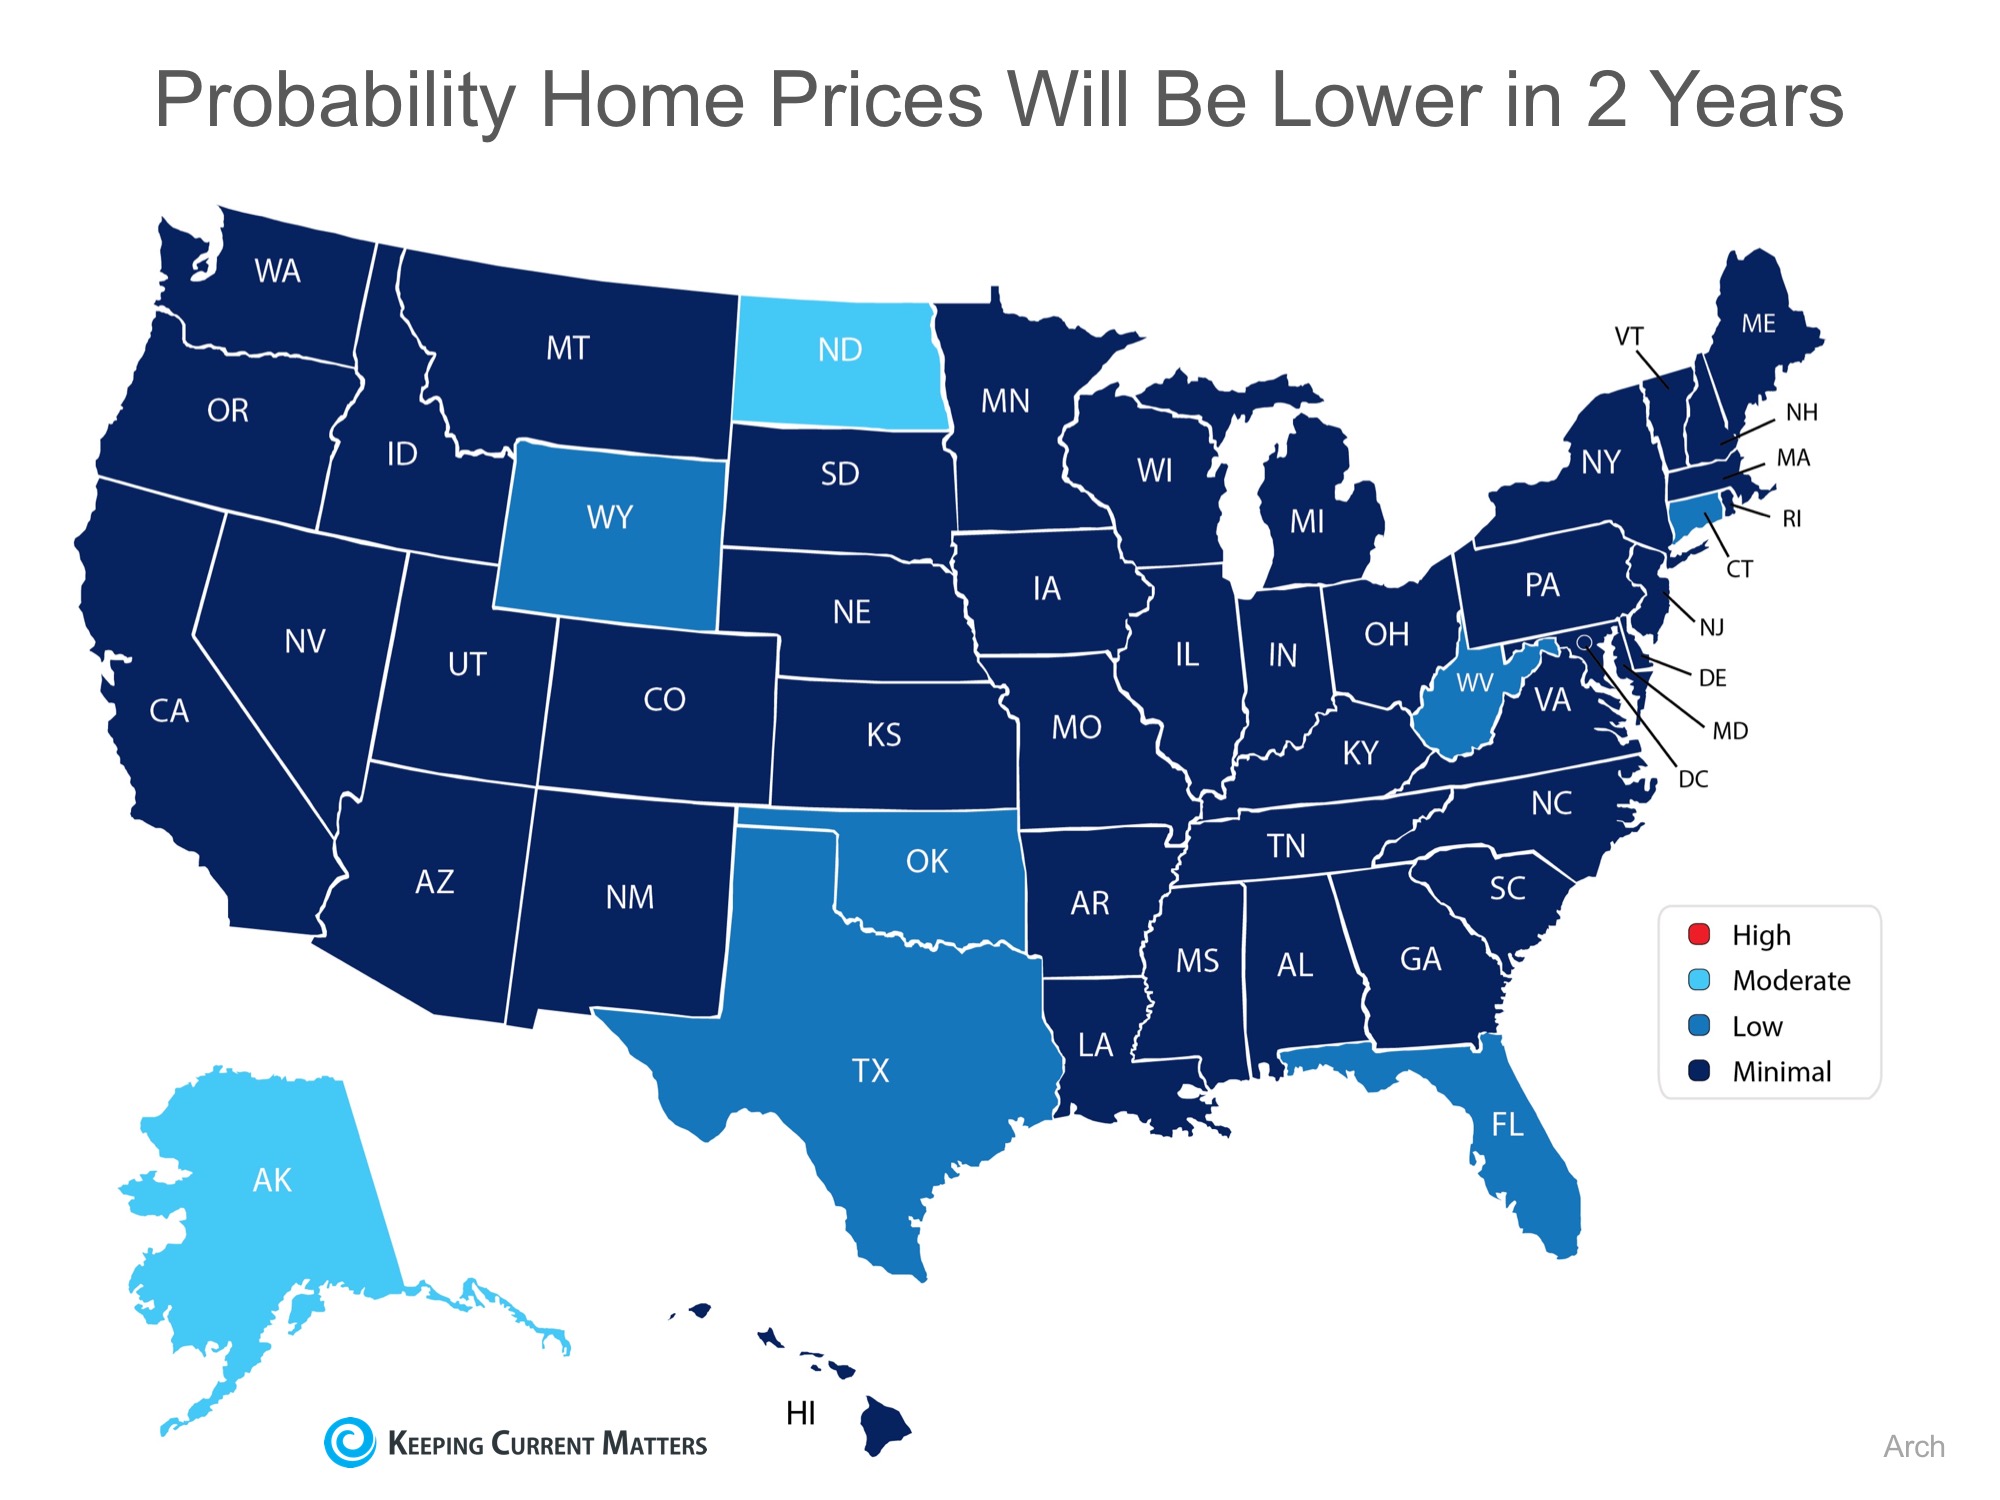
To this point, Arch Mortgage Insurance also revealed their Risk Index which estimates the probability of home prices being lower in two years. The index is based on factors such as regional unemployment rates, affordability, net migration, housing starts and the percentage of delinquent mortgages.
Below is a map depicting their projections (the darker the blue, the lower the probability of a price decrease):

(Source: Keeping Current Matters)


